What every product manager needs to know?
As a product manager, do you understand the metrics that truly reflect the success of your product? Not all metrics are of equal importance. Knowing which ones matter will help you navigate the complex world of product management. This article will examine the metrics every product manager should learn to drive growth and innovation. Imagine having tools at your disposal to track performance and predict future results.
Understanding product metrics involves distinguishing between numbers and metrics that provide value. Superficial or “vanity” metrics, such as the number of social media followers or video views, may seem impressive. But they rarely correlate to business results. On the other hand, metrics such as customer acquisition cost (CAC), conversion-to-payment rate, customer retention rate, and user engagement accurately reflect the success of your product.

The importance of key performance indicators (KPIs) in product management
Performance metrics, commonly called KPIs, are essential to every product manager’s responsibilities. They serve as a guiding compass to help evaluate product performance and make informed decisions. KPIs allow you to measure progress towards business goals, assess the development team’s performance and gain insights into user behaviour. Market penetration, product profitability, revenue growth rate, and customer satisfaction can all be evaluated using KPIs.
Understanding and selecting KPIs is especially important in today’s changing world. Product managers must carefully choose metrics that accurately reflect product and market strategy aspects. For example, KPIs such as sales or market share become particularly meaningful if the product aims to expand market share and grow presence. On the other hand, if customer retention and improved customer experience are prioritised goals, metrics such as churn rate and Net Promoter Score become more critical.
Integrating KPIs into product management practices provides benchmarks for optimising products and adapting strategies accordingly. Monitoring KPIs allows managers to observe trends, anticipate future changes and adapt quickly to new challenges. Continuous analysis of these metrics allows product managers to avoid reacting to changes. And to forecast them effectively, giving their products a competitive advantage and sustainable growth.
Key metrics
- Customer Acquisition Cost ( CAC )
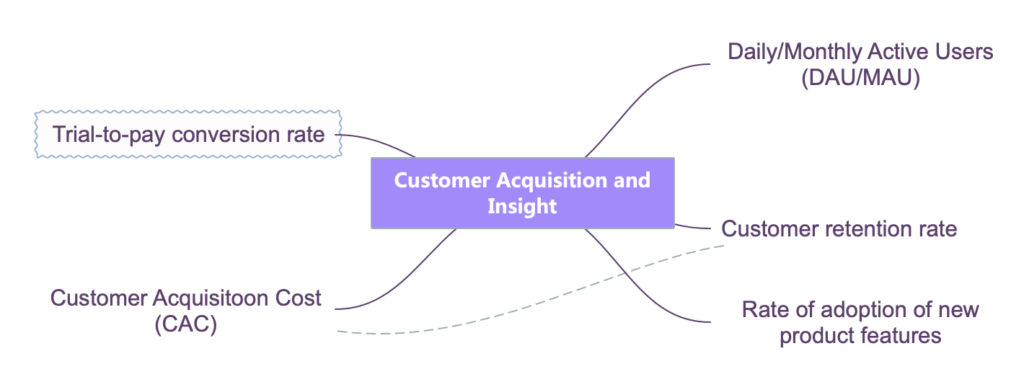
This metric estimates the cost to a company of acquiring each customer, including marketing and advertising costs. Effective management of CAC can lead to a return on investment (ROI) and provide insight into where costs can be reduced or marketing strategies improved.
- Trial-to-pay conversion rate
This metric reflects the percentage of users who convert from a free trial to a paid product purchase. A high conversion rate indicates a compelling value proposition and an effective sales process.
- Rate of adoption of new product features
This metric measures how quickly and effectively users start using new product features. It allows you to measure the success of releases and determine when adjustments or improvements are needed.
- Customer retention rate
This indicator measures the proportion of customers who continue to use the product after a certain period. A high retention rate indicates customer loyalty. Confirms the effectiveness of the long-term product development strategy.
- Daily/Monthly Active Users (DAU/MAU).
These metrics help to understand user activity every month. You can identify usage trends and predict user engagement levels by analysing DAU and MAU.

Financial metrics
Financial metrics play an important role in developing and adjusting product strategies. They provide product managers with data to assess viability, forecast growth and optimise profitability. By analysing these metrics, it is possible to understand not only the financial health of a product but also its potential. This lets you make informed decisions about investments, marketing campaigns, and new feature development.
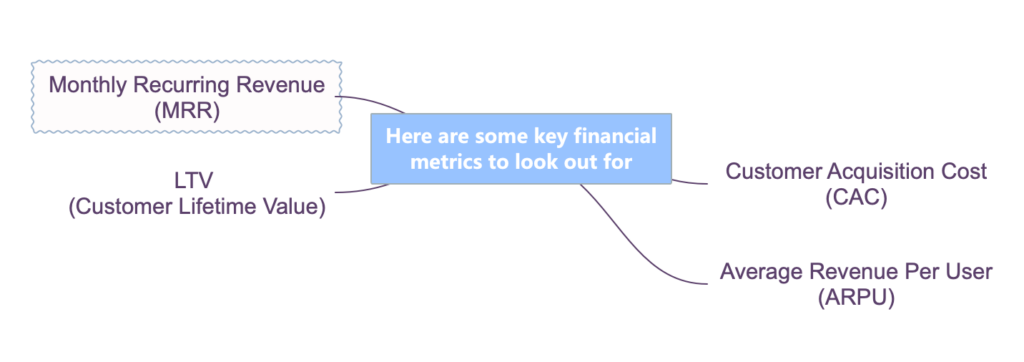
Here are some key financial metrics to look out for:
- Monthly Recurring Revenue (MRR)
This metric shows the revenue generated from subscriptions. It is significant for understanding the health of SaaS products and forecasting long-term revenue.
- LTV (Customer Lifetime Value)
LTV measures the value a customer is likely to receive over the lifetime of their interaction with a product. Understanding LTV helps calculate profitability and balance between customer acquisition costs and revenue.
- Customer Acquisition Cost (CAC)
CAC represents the cost incurred to attract customers. Comparing CAC to LTV allows you to evaluate how effectively a company uses its marketing resources.
- Average Revenue Per User (ARPU)
ARPU is calculated by dividing revenue by the number of users and estimates how much each user brings in on average. This metric is essential for assessing users’ value and optimising pricing strategy.

Optimising user engagement and retention
- Frequency of product usage (Stickiness)
The Stickiness metric shows user engagement and retention with a product. A higher score indicates that users frequently return to the product, indicating value and user satisfaction. You can consider ways to increase this score, such as incorporating gamification elements or providing recommendations.
- Churn Rate
The churn rate shows the percentage of users who stop using a product within a certain period. Reducing this rate requires understanding the reasons for churn and developing strategies to improve the user experience and customer retention. This can be achieved by improving customer support, introducing new features or changing pricing policies.
- Product Turnover Rate (Velocity)
Product velocity measures how quickly the team implements changes and updates. This metric relates to the team’s flexibility and ability to respond rapidly to user feedback and changing market demands. Velocity can be improved by optimising processes, improving communication within the team and implementing development methodologies.
Customer satisfaction score
- Net Promoter Score (NPS)
NPS assesses how likely customers are to recommend your product to others.It serves as a measure of customer satisfaction and loyalty. Increasing the Net Promoter Score (NPS) involves creating a favourable customer experience, which may include improving product quality, service levels and overall brand impression.
- Customer Satisfaction Score (CSAT)
CSAT directly reflects customers’ satisfaction after interacting with a product or service. It provides insight into how customers rate their experience with a product. Improving CSAT involves collecting and analysing customer feedback, conducting user experience research and regularly updating the product according to customer needs.

Acquisition metrics: Assessing the effectiveness of investments
Understanding customer acquisition metrics is essential to determine how effectively a company uses its resources to expand its customer base and increase revenue.
Cost per acquisition (CPA) shows the cost of acquiring each customer. This metric plays an essential role in evaluating the effectiveness of marketing campaigns—their impact on overall profitability. For example, if CPA is disproportionately high compared to the revenue generated from each customer, it may indicate that marketing strategies need to be reviewed and adjusted.
Return on advertising spend (ROAS) measures how much revenue each dollar spent on advertising generates. This metric measures how effectively advertising budgets are used and determines which channels or campaigns generate revenue. To improve return on ad spend (ROAS), you can focus on optimising targeting, creative elements and marketing messages.
Return on investment (ROI) serves as a measure of the effectiveness of investments in marketing and other areas of the business. It calculates the ratio of profit to cost. It determines whether an investment strategy is producing the desired results. Product managers can use ROI to evaluate the success of initiatives and make decisions about additional product or marketing investments.
Metrics for analysing bugs and errors
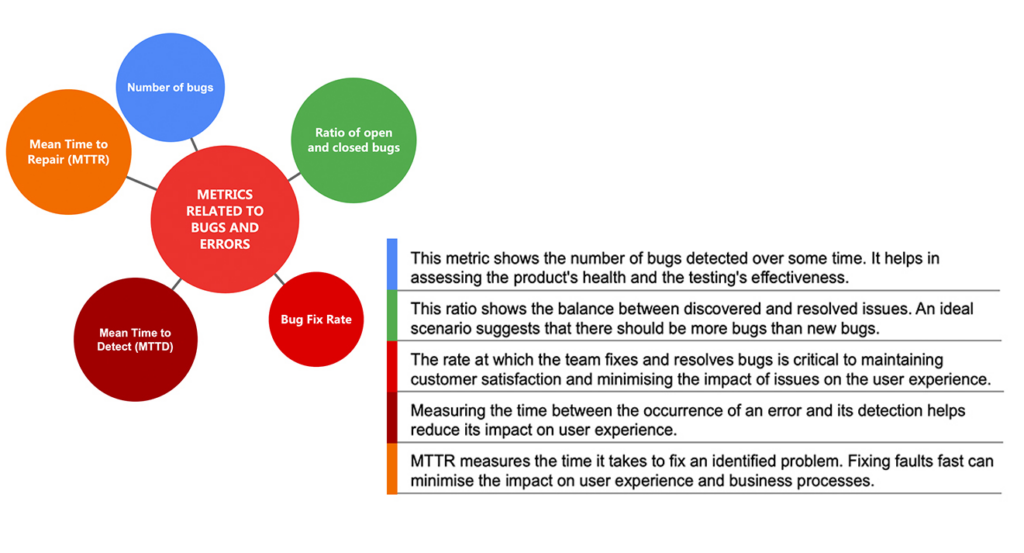
Product managers are responsible for maintaining product quality and reliability rather than product development. Tracking and analysing bugs and errors are essential in maintaining user trust and ensuring the product works. Here are some important metrics related to bugs and errors:
- Number of bugs
This metric shows the number of bugs detected over some time. It helps in assessing the product’s health and the testing’s effectiveness.
- Ratio of open and closed bugs
This ratio shows the balance between discovered and resolved issues. An ideal scenario suggests that there should be more bugs than new bugs.
- Bug Fix Rate
The rate at which the team fixes and resolves bugs is critical to maintaining customer satisfaction and minimising the impact of issues on the user experience.
- Mean Time to Detect (MTTD)
Measuring the time between the occurrence of an error and its detection helps reduce its impact on user experience.
- Mean Time to Repair (MTTR)
MTTR measures the time it takes to fix an identified problem. Fixing faults fast can minimise the impact on user experience and business processes.

Final thoughts
On the road to product management mastery, important metrics serve as allies. They are not numbers in reports. Instead, they reflect your product’s health, potential, and commitment to excellence. This article will dive into financial performance metrics, KPIs, operational efficiency, and product quality.
Remember that behind every number is a story. About your users, your product, and your team. Study them and realise their significance. Use them to tell your success story.
Your role as a product manager goes beyond interpreting data. It involves translating that data into steps to improve your product, increase customer satisfaction, and drive business growth.
Harness the power of metrics by letting them guide you. Let them serve as the foundation on which you build not a product but an entire philosophy that seamlessly blends technology, market trends, and user requirements. As you move forward step by step, you’ll see how each contributes to your brand’s vibrant and unique image.
